
How Bad is my Drinking Problem? (2023)
Yet more data in my quest for self-improvement

[The usual preamble, skip if you are familiar with my basic setup by now]
I drink more than I should. I’m confident about this. But, is it getting better/ worse, or staying the same? How do I know? To make the statement precise, I recorded the number of alcoholic beverages I consumed for every day in 2020, 2021, 2022, and (now) 2023. Each year I analyze this data and set goals for the subsequent year.
Note that "a drink" is not A Drink; total alcohol consumption depends on the volume V and ABV (%) of a given beverage. One can define Standard Drink Units (SDUs) in an alcoholic beverage as
where D=0.789 g/mL is the mass density of alcohol. By this definition, a 12oz can of 5% ABV beer, a 5 oz glass of a 12% ABV wine, or a 1.5 oz shot of an 80 proof = 40% ABV liquor, all give 1 SDU.
On the basis of some research I reviewed in 2019, we can set some approximate thresholds to keep in mind. The FDA-recommended maximum drinks/day for men is 2 SDU/day, and their thresholds for “Heavy Drinking” are 4 SDU/day or 14 SDU/week for men (see post for discussion of women, not relevant here).
[end preamble]
\\ Annual Alcohol Intake
Let me say from the outset: I said at the end of 2022 that I would try to abstain from alcohol completely in 2023. This failed after about 1.5 months, and I never really got back on track after that. Still, there were substantial improvements this year that make me optimistic overall.
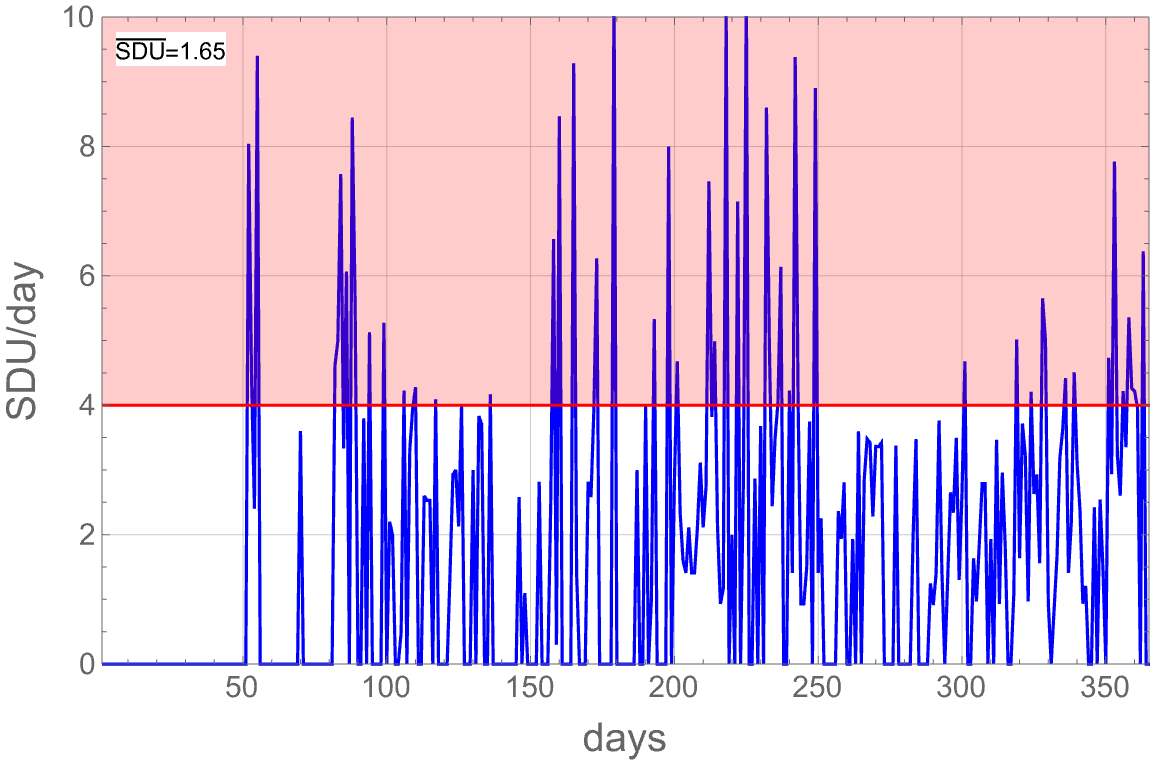
Here is the dataset plotted over the course of 2023 in days:
or in # drinks
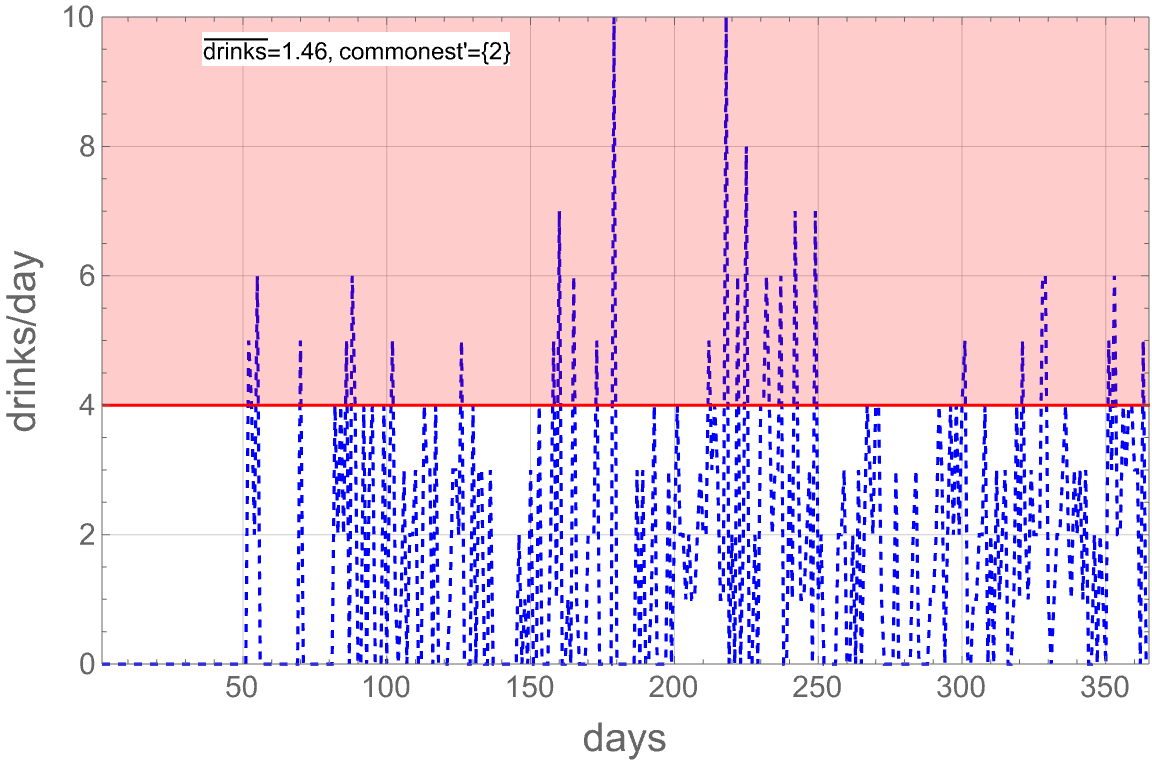
The meta-data shown in these figures is (a) the average number of SDUs/day, (b) the average number of drinks/day, and (c) the most common # of drinks excluding zero (denoted commonest’).
In total, I consumed 601 SDUs in 2023, compared with 801.7 SDUs in 2022 and 894 SDUs in 2021 (estimated using a fudge factor, see later section), a reduction of ~201 SDUs.
Recall that my goal for 2022 was 600 SDUs, so although I missed the mark in that year I have reached it in 2023.
I consumed 534 drinks in 2023, compared with 657 drinks in 2022 and 625 in 2021.
On paper, I’ve improved year-by-year these past two years. However I have reason to believe that the supposed improvement from 2021 to 2022 was at least partly fake, based on an approximate translation from drinks to SDUs. The improvement this year was, I think, real and substantial. I’ll discuss what went well and what went poorly overall in the sections that follow.
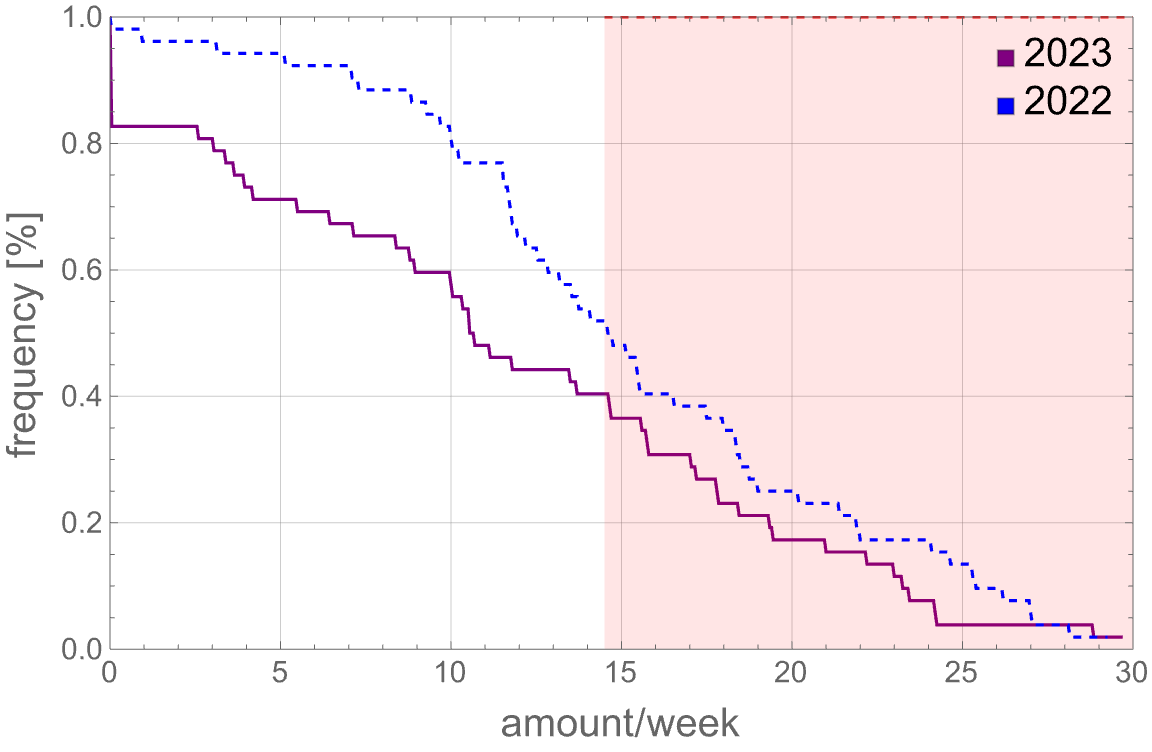
How often did I drink more than 2 SDUs? To quantify this, I define
Of course, if x=0 then f(x)=1 by definition, and if x»10 or so then f(x)=0. This captures the same idea as the point-wise frequency did in 2020 and 2021.
Here’s the result (2022 in blue, 2023 in purple)
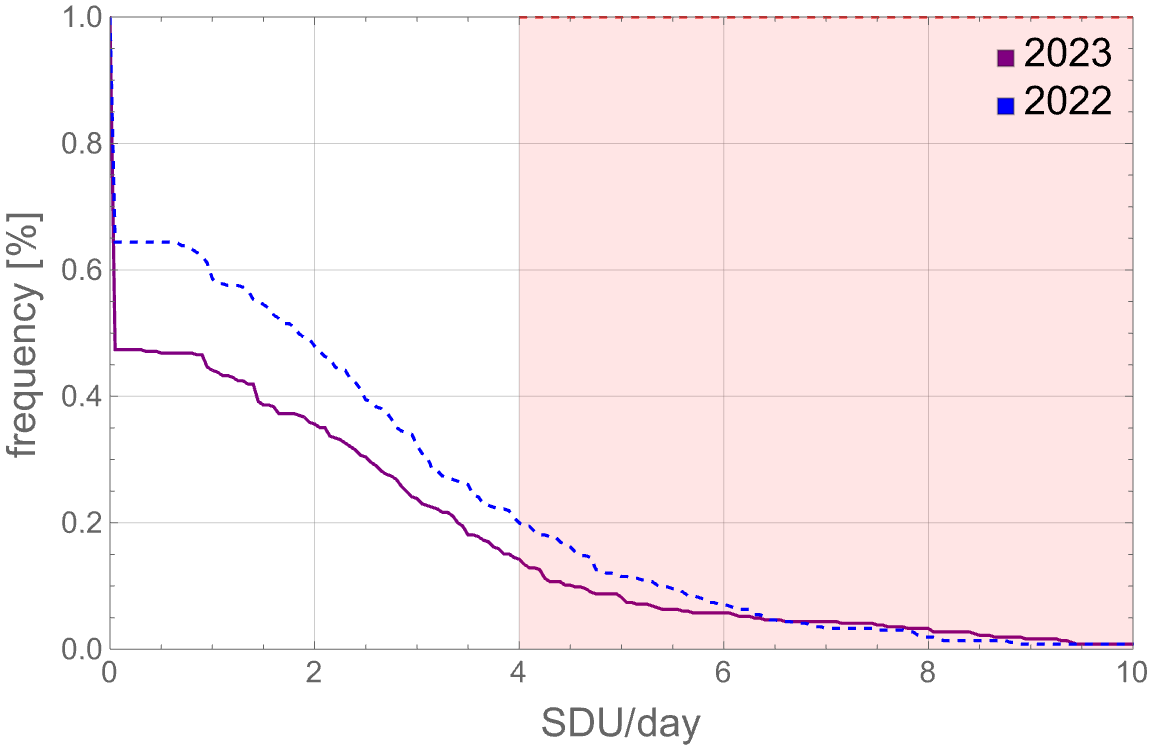
There is a visible decrease in SDU/day < 6, and a minor increase (!!) for SDU/day > 7.
I drank fewer than 2 SDU/day on 64% (235) of days, compared to 52% (190) of days in 2022.
Recall that my goal for 2022 was >60% days with < 2 SDUs, so although I missed the mark in that year I have reached it in 2023.
The number and fraction of days where I consumed x SDUs was:
x<2: 190 days, 64.4% (52.1% in 2022)
2<x<4: 102 days, 21.4% (27.9%)
4<x<6: 47 days, 8.5% (12.9%)
x>6: 26 days, 5.8% (7.1%)
In all bins but the first one, the numbers are down this year. Good!
\\ Weekly / Monthly Intake
Weekly intake (thick = SDUs, dashed = # drinks):
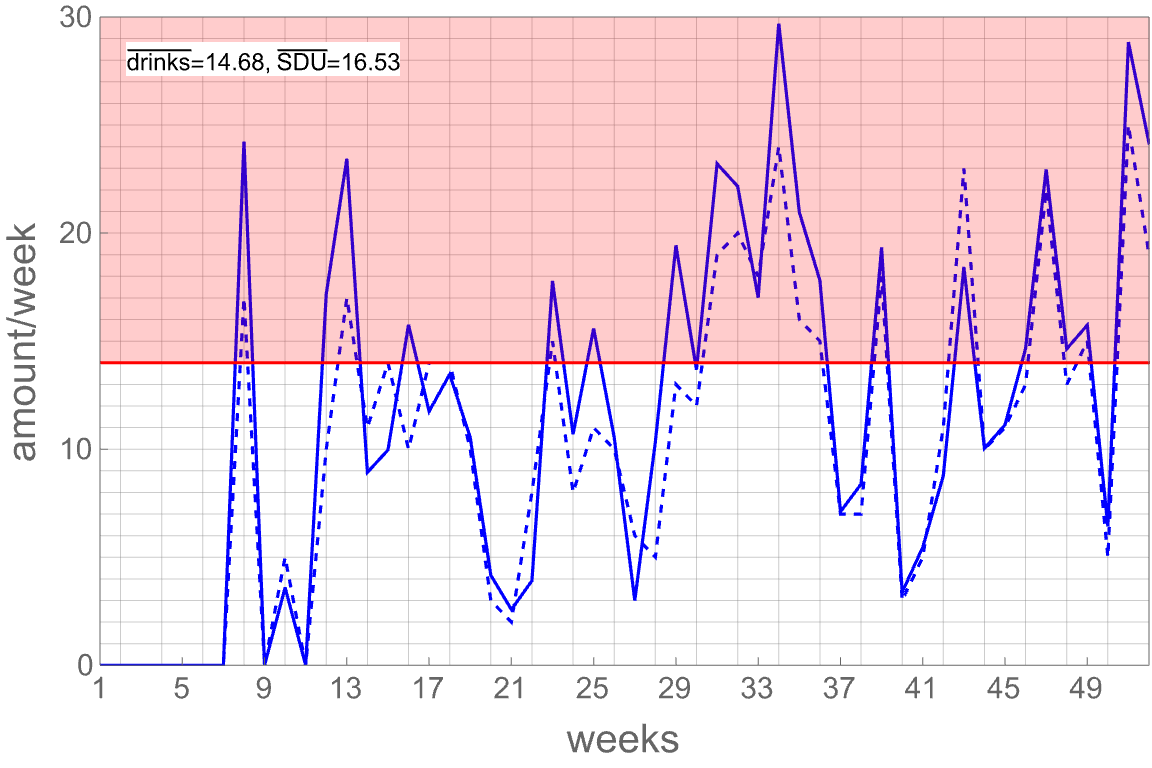
Mean is still above 14 SDU/week, with quite a lot of variance. Frequency is unambiguously improved, compared to last year.
…except for one weird week with ~28 SDU. The fraction of weeks with SDU/week < 14 was 59.6%, c.f. 46.1% in 2022. More generally, the number and frequency of weeks with x SDUs was:
0≤x<7: 17 weeks, 32.7% (4, 7.7% in 2022)
7<x<14: 14 weeks, 26.9% (20, 38.5%)
14<x<21: 13 weeks, 25% (16, 30.8%)
21<x<28: 6 weeks, 11.5% (10, 19.2%)
x>28: 2 weeks, 3.8% (2, 3.8%)
Unambiguous improvement!
Here are the month-by-month breakdown of the data (thick line = SDUs, dashed = # drinks):


My best months were January and February, where I (almost) completely abstained, followed by May. My worst months were August, November, and December, which all had SDU/day > 2 (“heavy”); I visited family during these months, which I think drove some of the excess drinking.
I note that it is good that my average SDU/day in 9 of 12 months was <2, and my commonest # drinks (aside from 0) was 2 in most months as well. It would be nice to achieve commonest’=1.
\\ What worked? What didn’t?
Though I didn’t drink literally 0, and still drank quite a lot, I made significant gains this year compared to any year in recent memory. Why? There are a few concrete things that seemed to drive the total number down.
\\ “Fudge Factor” = SDU/drinks decreased
In 2020 and 2021 I recorded only “# of drinks” not SDUs, but over time I started to realize how imprecise this was and how badly I might be fooling myself. In 2021, I approximated that I was underestimating my actual alcohol consumption by a factor of FF~1.43 (I’ll call this my fudge factor), with large error bars of course. In 2022, by tracking # drinks as well as SDUs (separately), I was able to compute the fudge factor to be FF~1.18-1.22, where the upper (lower) value excluded (included) points which anomalously have SDUs=0 but drinks≠0, an indication of some error in the dataset.
This year (2023), the fudge factor appears to be even smaller: FF~1.11-1.14, based on the same criteria. There were 6 anomalous points this year, marked in red color below.
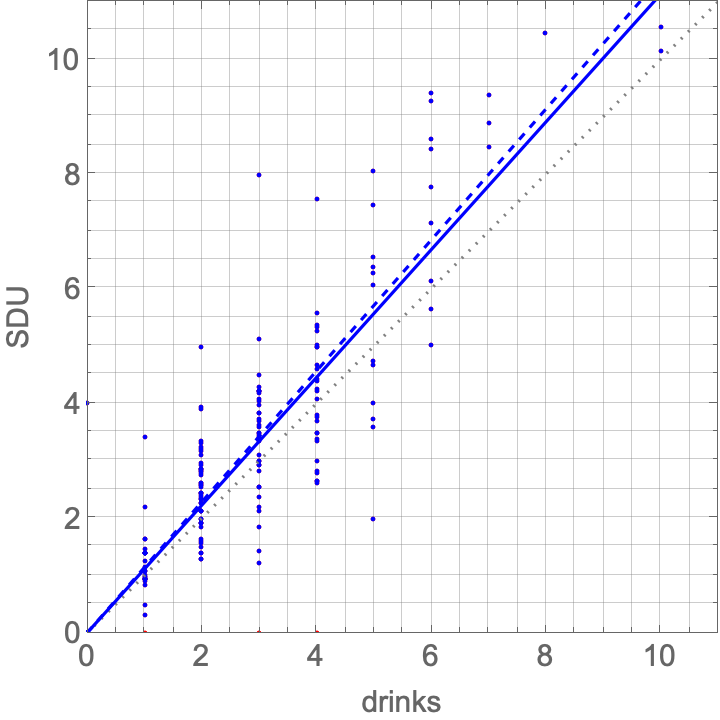
The grey dotted line corresponds to drinks=SDUs, i.e. FF=1, whereas the blue dashed (thick) lines correspond to the upper and lower estimates above, respectively.
The fact that FF is decreasing over time likely indicates that I am drinking lower ABV or smaller drinks on average year by year. This difference alone is sufficient to explain a significant fraction of my decrease in consumption in 2023 compared to 2022: (601/802)*(1.2/1.1)~0.82.
Subjectively, I notice that I do select drinks for low ABV, other things being equal, and this likely drives part of this effect.
\\ Actually drinking less… sometimes
As stated above, the number of drinks I consumed in 2023 was 534, compared with 657 in 2022. You can’t fake that; it’s more than 100 fewer containers with alcohol in them which were poured into the front of my head.
The biggest gains were in (a) days I didn’t drink, and (b) days I drank a little. That is, my heaviest drinking was streaky/bingy. Comparing average SDU/day across months, my worst 2023 month (August, 3.26 average) was just as bad as my worst 2022 month (May, 3.3 average). This is also evidenced by the frequency plots: the days when I drank the most (>7 SDU/day) were just as frequent this year as last.
This is all consistent with a running theme of my journey thus far: once I start it’s hard to stop. This applies both within a day that I drink (I often like to have more and more), as well as across days (I’m more likely to drink if I drank in other recent days).
\\ For 2024
My journey is ongoing, but I’m happy with my progress in 2023, and want to build on it in 2024. The whole point of this exercise is incremental, sustainable progress; that’s what I’ll focus on for next year as well.
As before, I’m going to start the year not drinking and go as long as I can manage; my goal for 2024 is to go two full months without drinking (Jan and Feb), which I almost accomplished in 2023. The streaks matter, so I’ll also try to do at least 1 additional no-drinking month later in the year.
Aside from that, my goal is to drink fewer than 500 SDU in 2024, i.e. reduce by at least 100 SDU.
Finally, my goal is to have commonest’=1 in at least one month of the year, which is to say, most common number of drinks (aside from 0 drinks) is 1. It’s ok to have 1.
Thanks for following!
[In case anyone else is having similar alcohol-related struggles, or just wants to have better data on their consumption: please feel free to reach out! I have discovered and developed some tools (apps, spreadsheets, Mathematica notebooks) for effectively tracking these things that I’m happy to share with anyone who would find them useful.]