
How Bad is my Drinking Problem? (2022)
More data in my quest for self-improvement

I drink more than I should. I’m confident about this. But, is it getting better/ worse, or staying the same? How do I know? To make the statement precise, I recorded the number of alcoholic beverages I consumed for every day in 2020, 2021, and (now) 2022. Each year I analyze this data and set goals for the subsequent year.
Note that "a drink" is not A Drink; the number of Standard Drink Units (SDUs) in an alcoholic beverage of volume V and a given ABV % is defined as
where D=0.789 g/mL is the mass density of alcohol. By this definition, a 12oz can of 5% ABV beer, a 5 oz glass of a 12% ABV wine, or a 1.5 oz shot of an 80 proof = 40% ABV liquor, all give 1 SDU.
On the basis of some research I reviewed in 2019, the recommended maximum drinks/day for men is 2 SDU/day, and the thresholds for “Heavy Drinking” are 4 SDU/day or 14 SDU/week for men (see post for women). In 2020 and 2021 I recorded only “# of drinks” not SDUs, but last year I started to realize how imprecise this was and how badly I might be fooling myself. I approximated that I was underestimating my actual alcohol consumption by a factor of ~1.43 (I’ll call this my fudge factor), with large error bars of course.
This year, I recorded my total consumption in SDUs, the more relevant measure, but also (separately) in # drinks to see how close the 1.44 factor was. Here, observe the correlation between the daily SDU data and the # drinks on the same day:
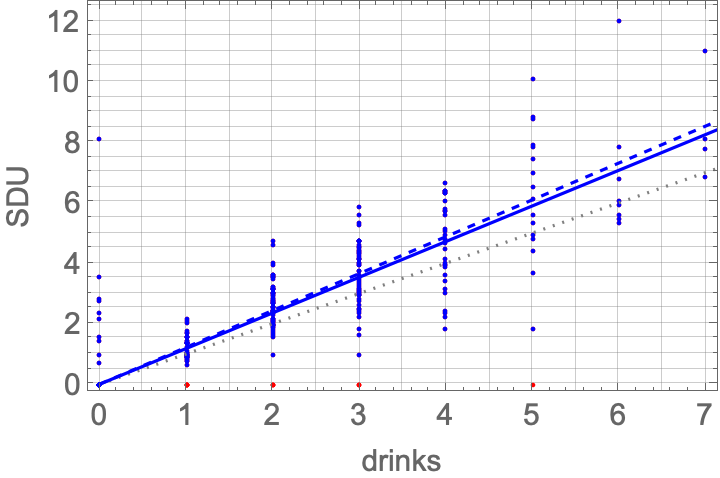
The gray dotted line corresponds to SDU=drinks, and we see that as expected most points lie above the line (i.e. # drinks underestimates actual alcohol consumption). The best linear fit through (0,0) (blue thick line) gives SDU ∝ b x with b=1.18±0.02 SDU/drink (standard error).
The red points, which supposedly correspond to SDU=0 but drinks ≠ 0, have to be a reporting error. If we remove those points, the best linear fit (blue dashed line) gives b=1.22±0.02 SDU/drink. All this suggests I maybe overestimated the fudge factor last year, and/or drank lower ABV / smaller drinks this year.
Anyway, on to the actual intake data. As Zvi says, let’s run the numbers.
Annual Alcohol Intake
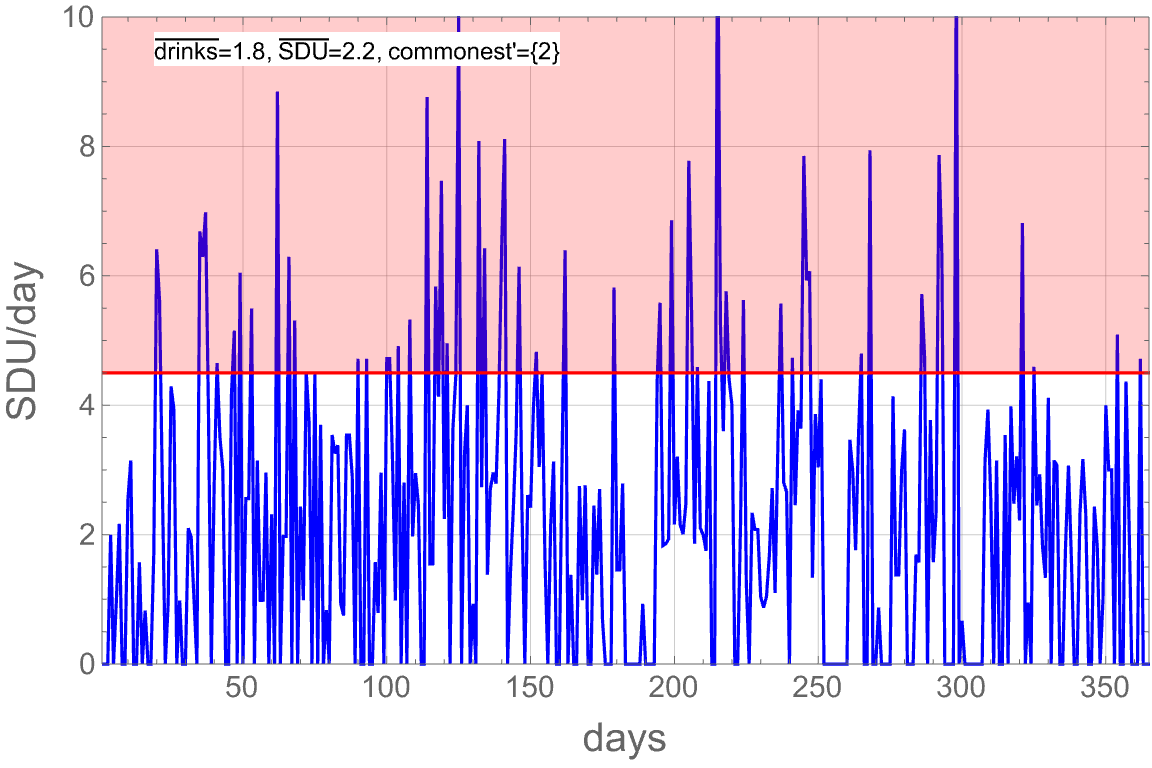
Here is the data over the course of 2022:
Because it’s already messy, I’ll show # drinks separately (dashed blue line below):
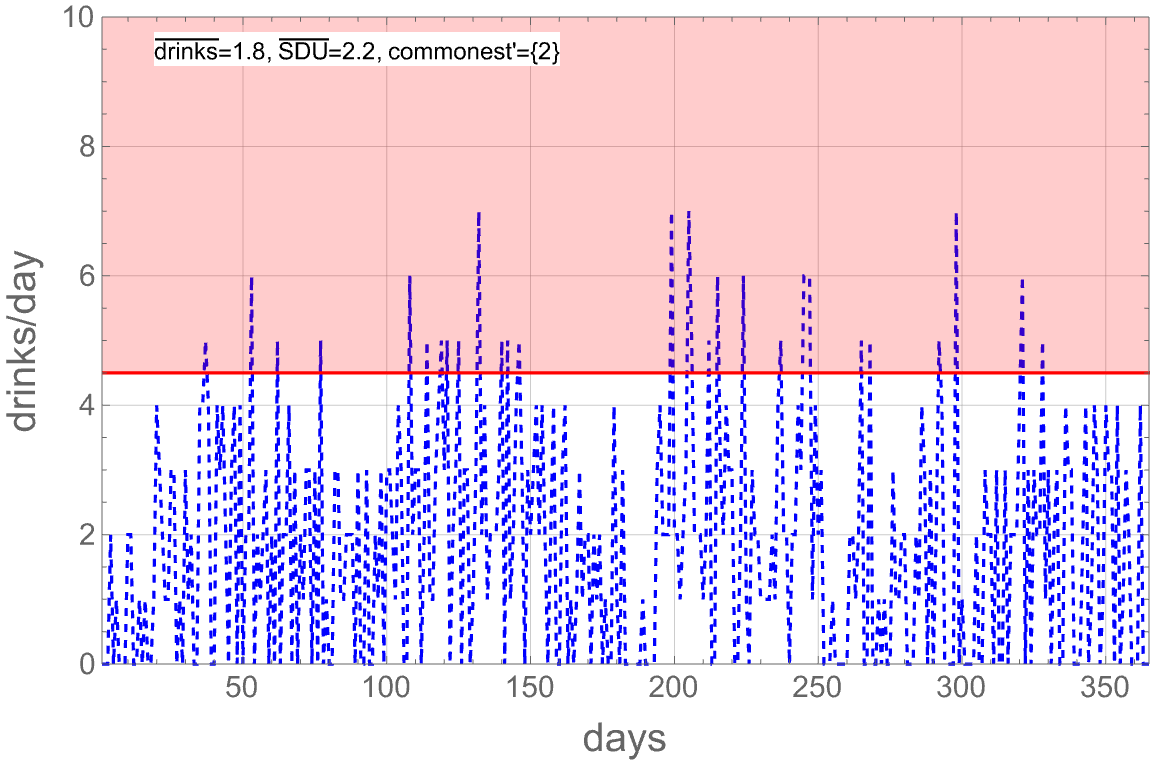
The meta-data, shown in both figures, is (a) the average number of drinks/day, (b) the average number of SDUs/day, and (c) the most common # of drinks excluding zero (denoted commonest’). The ratio of (avg SDUs)/(avg drinks) = 1.22, c.f. the fudge factor 1.43. This is more in line with the linear fit of the SDU/drink data, which gave ~1.2.
In total, I consumed 801.7 SDUs in 2022, compared with 894 SDUs in 2021 (estimated using my fudge factor), a reduction of ~92 SDUs. My goal was 600 SDUs, so I missed by a pretty sizeable margin.
I consumed 657 drinks in 2022, compared with 625 in 2021.
I’m disappointed in this. On one hand, I saw cut 92 SDUs compared to my (fudged) estimate from last year. On the other hand, I had more drinks. The only ways this can be made consistent are (1) I drank more drinks of lower ABV/drink, or (2) my fudge factor from last year was a significant overestimate. If (2) (I’ve given some reasons to believe this already), I may actually have consumed more alcohol this year compared to 2021. I think (1) is at least somewhat true—I made a conscious effort to do precisely this—but still, a poor showing overall.
How often did I drink more than e.g. 2 SDU? In previous years, with only point-wise data on # drinks, I used
frequency[N drinks] = (# days with N drinks)/(total days),
but I can do better with the continuous parameter SDUs by defining
Of course, if x=0 then f(x)=1 by definition, and if x»10 or something then f(x)=0. This captures the same idea as the point-wise frequency did in previous years.
Here’s the result (2022 in blue, 2021 in purple, the continuous line is SDU and the points are # drinks):
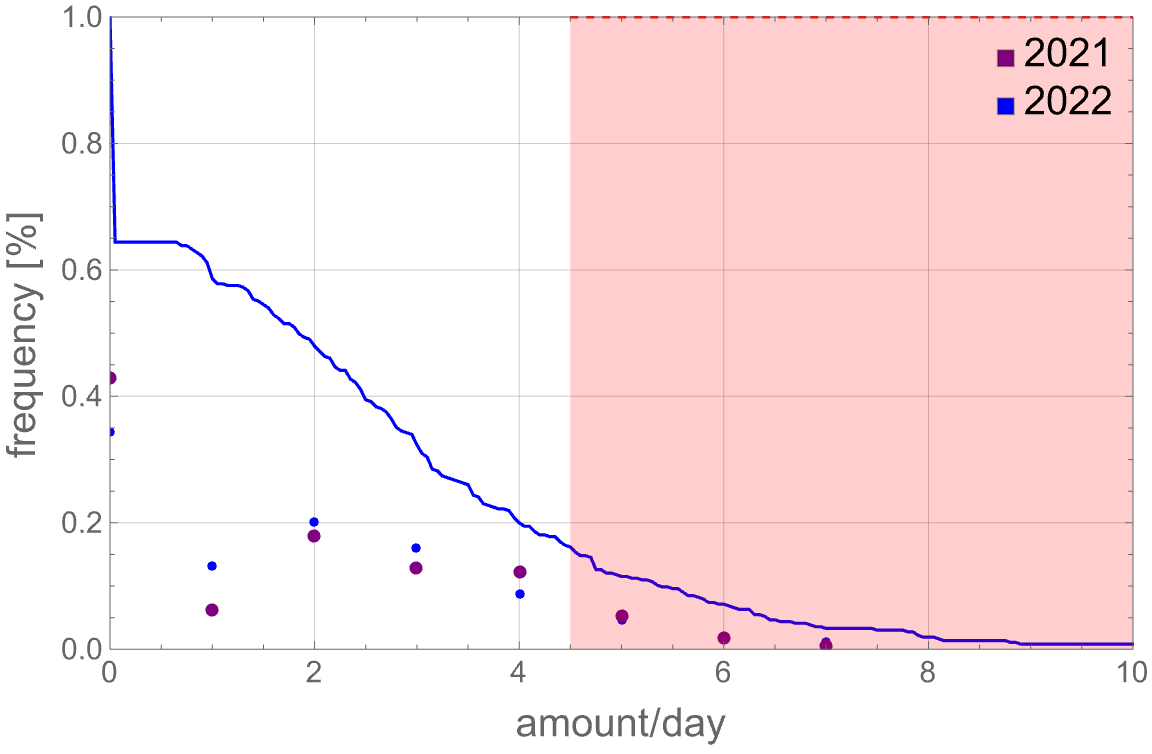
First, comparing the points: I had 0 drinks on fewer days in 2022 than in 2021, but 1 or 2 drinks more often. This was by design: as I explained last year, shooting for 0 drinks isn’t really the best measure of success, since there seems to be no negative health outcome for e.g. 1 SDU/day. As a consequence (maybe), I drank 4,5, and 6 drinks less often this year, which is good.
I had a frequency target for this year: to drink fewer than 2 SDU on 60% of days (219 days). I got to only 52% of days (190).
The number and fraction of days where I consumed x SDUs was:
x<2: 190 days, 52.1%
2<x<4: 102 days, 27.9%
4<x<6: 47 days, 12.9%
x>6: 26 days, 7.1%
Still too many of those runaway days.
Weekly / Monthly Intake
Weekly intake (thick = SDUs, dashed = # drinks):
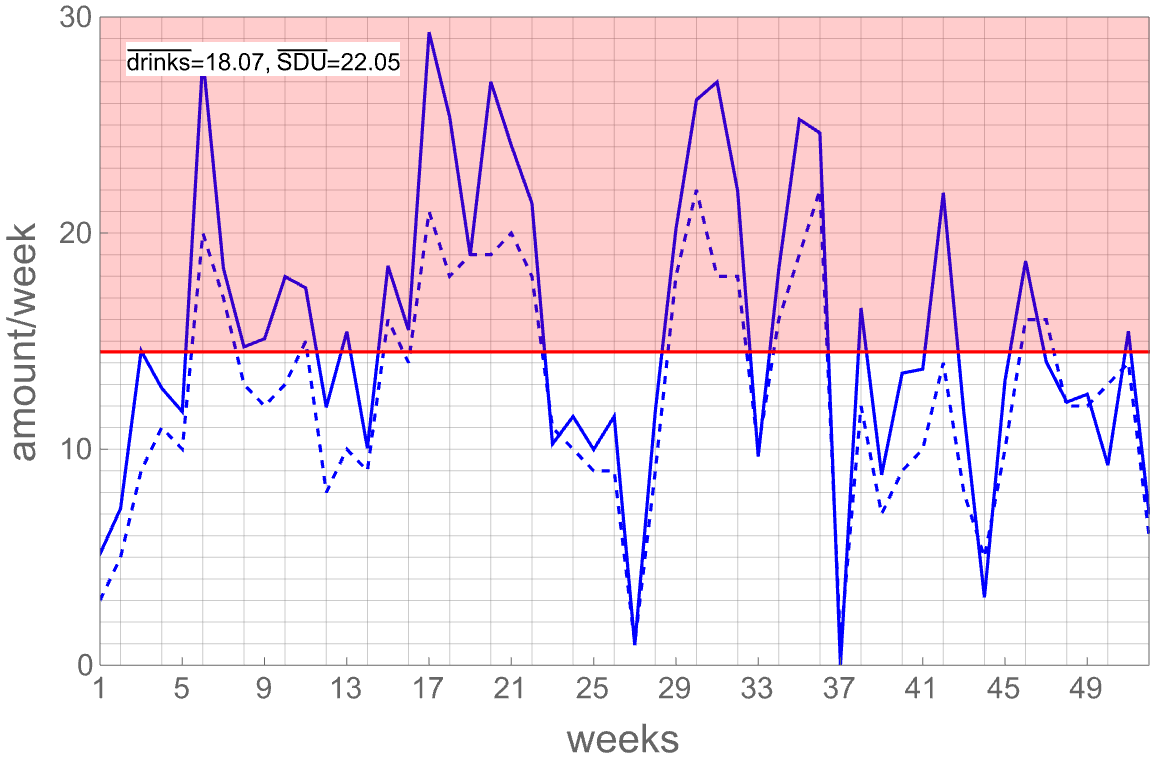
Mean is way too high, compared to the target of <14 SDU/week.
My week-related target was to keep entire 6 months below the weekly threshold of 14 SDU/week (compared to 1 in 2021). Eyeballing the data, I maybe did it in January and one other month between Week 22 - 28 (June, maybe?). Definitely did not hit this target.
The frequency is a mixed bag too:
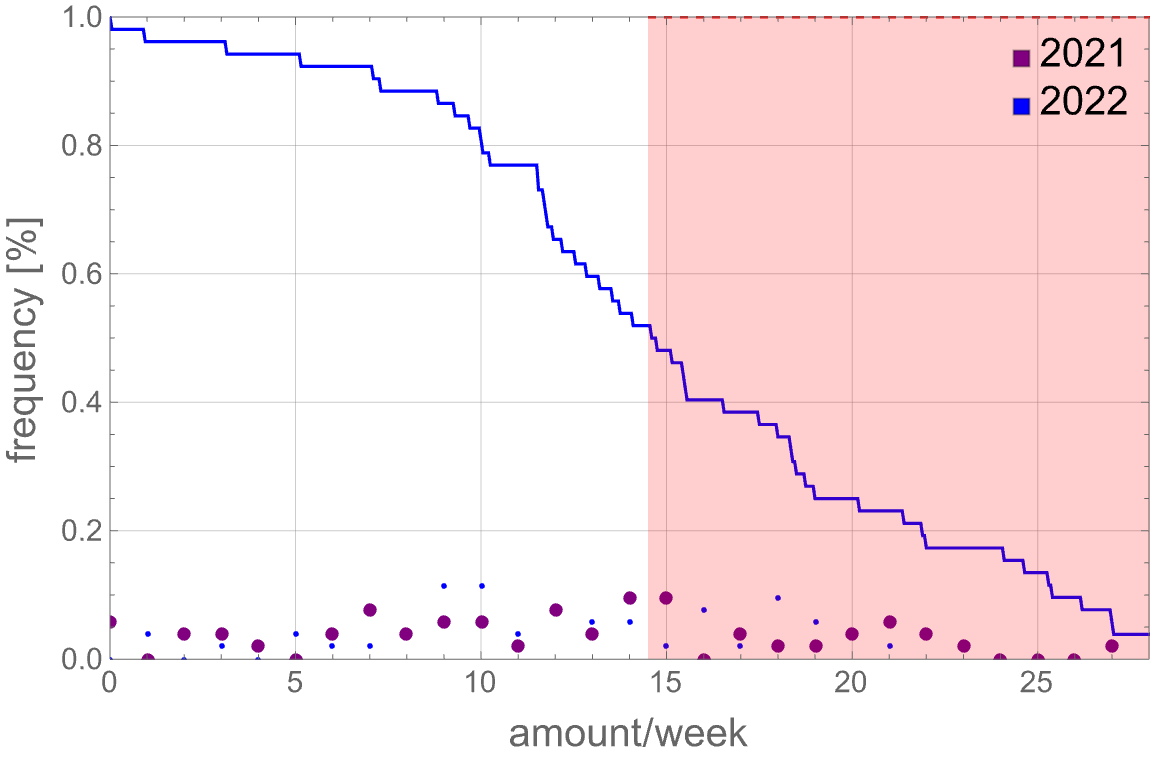
Same conventions as for days. The number and frequency of weeks with x SDU was:
0≤x<7: 4 weeks, 7.7%
7<x<14: 20 weeks, 38.5%
14<x<21: 16 weeks, 30.8%
21<x<28: 10 weeks, 19.2%
x>28: 2 weeks, 3.8%
If I’m generous, I’d say the number of weeks below 14 SDU/week was 24, or 46%, which is pretty close to the 6 month target if I forget about the streak. Still, it’s too much.
I didn’t have a month-related goal, but for completeness here are the month-by-month breakdown of data (thick line = SDUs, dashed = # drinks):


My best months (by a large margin) were January and December, probably because these are the months I’m most focused on the new/almost finished resolution. Worst month (also by a large margin) was May; I was traveling for work, but I did that a lot this year in other months, so that’s not a perfect explanation.
How am I doing?
Not great. My long-term trajectory is still towards improvement and I have ideas for how to continue this at the margin, but the data this year indicates either a flattening or even some regression.
But I’ve been thinking…
Over the past few years some things have lined up for me. One of my brothers stopped drinking completely (for more than a year, anyway) by reading a book by Allen Carr; one of his top tips is (paraphrase) “don’t reduce alcohol consumption; just quit, it’s easier.” Lex Fridman asked Tyler Cowen for advice for young people, and without skipping a beat Tyler said “Don’t drink; that’s the advice.” Lex laughed it off, but Tyler was being totally serious. (The whole conversation is excellent.)
Also, there have been times in the past years where I have some pain or illness, and I wonder, “could this be a liver problem related to a long-standing drinking habit?” And I think the answer has always been “no”, but more and more it feels like there’s a problem with this answer being plausible in the first place.
Several other similar signals around me seem to point to not drinking as a path forward. I’m not saying I’ll never drink again, but it might be nice to see what it’s like for a year. I thought I could get a handle on it year-on-year, and maybe that’s still possible, but as a matter of past experience I seem to have trouble just doing it a little. So, we’ll try zero.
So, in 2023 I’m not going to drink.
I do think a lot about the Louis C.K. bit, where he says something like: “I neeeeeever do drugs. Never! …………….. so that when I do, it’s way more fun!” Alcohol has been a part of my not-quite-daily routine for more than a decade. It’s just become another part of life, not a fun and interesting novel thing to try once in a while. If I do go back to drinking in 2024, I hope I can get that fun and exciting version of it back.
See you next year; hopefully there will be very little to report. :)